Top 10 Injection Molded Parts Suppliers Worldwide?
Injection molded parts support products used every day, from medical housings and automotive clips to appliance panels and electronic connectors. Their value is easy to overlook. A two-gram component can determine whether an assembly fits, seals, or fails.
Industry research shows why supplier selection deserves closer attention. Grand View Research’s Injection Molded Plastics Market Size, Share & Trends Analysis Report identifies automotive, packaging, electronics, and healthcare as major demand sectors. Fortune Business Insights also forecasts continued market expansion, driven by lightweight design, mass production, and rising plastic component use. These reports describe market direction, not individual supplier performance. That distinction matters.
This guide examines ten leading injection molded parts suppliers worldwide through practical manufacturing criteria. These include mold engineering, material capability, dimensional control, production scale, validation procedures, and regional delivery support. Quality certifications can help, but certificates alone do not prove consistent performance. A supplier may hold ISO 9001 certification yet struggle with warpage, flash, or changing resin batches.
Real experience often appears in small details. Ask how a supplier manages tool maintenance, first-article inspection, cavity balance, and production traceability. Request evidence, not polished promises. Supplier rankings are never perfectly objective. Public data can be incomplete, and some private manufacturers disclose little about capacity or customer programs. This article therefore combines industry visibility with manufacturing relevance, while recognizing that the “best” partner depends on part geometry, tolerances, annual volume, compliance needs, and total landed cost. No ranking is final. It should support careful comparison, not replace an audit, sample review, or engineering discussion.
Global Injection Molding Market Size, Growth Rate, and Regional Demand
Global injection molding demand continues to expand across automotive, medical devices, electronics, packaging, and consumer products. Grand View Research estimated the global plastics injection molding market at approximately USD 198 billion in 2023. Its report projects a compound annual growth rate of about 4.6% from 2024 to 2030. Definitions vary, however. Some reports include machinery and tooling, while others measure molded products only.
Asia-Pacific remains the largest regional market, supported by strong electronics production, vehicle manufacturing, and expanding healthcare capacity. China, Japan, South Korea, and India create dense supplier networks with different cost and quality profiles. North America shows steady demand for lightweight automotive components and domestically sourced medical parts. Europe is growing more cautiously, with pressure from energy prices, sustainability targets, and stricter material traceability. The market is not moving evenly.
Tips: Compare suppliers using cycle time, mold life, dimensional capability, resin traceability, and documented quality systems. Ask for recent process data, not only attractive samples. A low quotation may hide maintenance costs, slower production, or expensive logistics. Regional proximity can matter more than a small unit-price advantage.
The Fortune Business Insights injection molding market analysis also identifies automation, recycled polymers, and complex multi-material parts as important growth factors. These trends favor suppliers with robust process monitoring and engineering support. Yet forecasts remain imperfect. Resin prices, trade policies, and regional energy costs can quickly change purchasing decisions. Buyers should refresh market assumptions before signing long-term agreements.
Supplier Ranking Criteria: Revenue, Press Tonnage, Capacity, and Certifications
Top 10 Injection Molded Parts Suppliers Worldwide?
A reliable supplier ranking should begin with measurable evidence, not reputation alone. Revenue indicates financial strength, but it does not guarantee stable production. I would compare audited annual revenue, order consistency, and investment in tooling, automation, and quality laboratories. Large numbers can mislead. Some suppliers report group revenue, while their molding division remains small.
Press tonnage reveals manufacturing range. A supplier operating machines from 80 to 2,000 tons can support both precision housings and large structural parts. Capacity should include machine count, operating shifts, utilization rates, and available clean production space. A factory with 120 presses may have little room during peak seasons. Ask for recent capacity records. Not promises.
Certifications provide another practical filter. Quality systems, environmental controls, and industry-specific approvals should match the buyer’s risk level. Auditors should verify certificate scope, expiration dates, and production-site addresses. During supplier visits, inspect material labels, first-article reports, dimensional records, and corrective-action logs. These details show daily discipline. Photos are not enough. My ranking would weight revenue at 20%, press tonnage at 25%, verified capacity at 30%, and certifications at 25%. This balance favors usable capability over impressive marketing. Still, the model is imperfect. A smaller specialist may outperform a larger factory on complex tolerances. Customer references and sample parts deserve a final human review before any Top 10 list is published.
Top 10 Worldwide Suppliers by Materials, Industries, and Production Regions
Top 10 Injection Molded Parts Suppliers Worldwide
The top ten worldwide suppliers differ by materials, industries, and production regions. Strong suppliers process polypropylene, ABS, polycarbonate, nylon, POM, and thermoplastic elastomers. Material control matters. A clean resin-drying record can prevent bubbles, brittleness, and surface defects during production.
Regional capability also shapes supplier selection. East Asian factories often provide high-volume electronics and consumer parts. European plants commonly support automotive, industrial, and medical programs with strict traceability. North American facilities can shorten delivery for regional customers. Southeast Asian production adds capacity and competitive labor costs, but supplier audits remain essential.
The leading suppliers serve demanding industries, including automotive, healthcare equipment, electronics, packaging, and industrial machinery. Their strengths should be judged by mold design, tolerance control, validation reports, and stable cycle times. Ask for first-article samples. Inspect gate marks, weld lines, sink marks, and dimensional drift. A supplier with automated inspection may still miss a design weakness.
Price can mislead. A cheaper mold may require frequent repairs or create excessive scrap. Production volume, tool complexity, resin grade, and regional logistics should influence the comparison. No ranking stays perfect. A supplier successful with small medical housings may struggle with large structural panels. Real factory visits, customer references, and recent quality records provide stronger evidence than polished sales claims.
Supplier Selection by ISO 9001, IATF 16949, Tooling, and Quality Metrics
Choosing among the top injection molded parts suppliers worldwide requires more than comparing prices. ISO 9001 certification shows a structured quality system, but buyers should verify its scope and renewal status. For automotive programs, IATF 16949 indicates stronger process control and traceability expectations. Ask for recent audit findings, corrective action records, and documented training evidence.
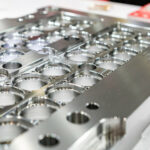
Tooling capability often separates reliable suppliers from capable-looking candidates. Review mold design samples, steel specifications, cooling layouts, and maintenance schedules. A supplier should explain how it controls shrinkage, warpage, flash, and cycle-time variation. During a factory visit, inspect tool rooms, measurement equipment, resin storage, and first-article inspection areas. Small details matter.
Quality metrics should be specific and comparable. Useful indicators include PPM defect rates, on-time delivery, scrap percentage, capability indices, and customer complaint response time. Request data from similar materials and part geometries, not only overall averages. A supplier may report excellent PPM figures while excluding rework or sorting activity. That deserves a careful question. Real experience shows that polished presentations can hide weak process discipline. I would also require a pilot run before full production, although this adds time and cost. Some evaluations remain imperfect because supplier data is self-reported, and audits capture only one moment. Regular reviews, transparent records, and practical engineering communication provide stronger evidence than certificates alone.